
How to Add Charts to Your Customer Portal
The Chart widget turns CRM data into a doughnut, bar or line chart, so portal users can see totals and trends without reading a list. For example, show a portal user’s cases by status, or orders by shipping method. The portal fetches the chart’s records from your CRM on demand, so the chart reflects your CRM data rather than a separate copy.
Before you start
- You need access to the Design menu in the admin portal.
- Enable the entity (Dynamics 365), object (Salesforce) or table (Business Central) you want to chart. See How to Enable CRM Entities and Custom Objects in the Portal.
- To limit which records the chart counts, create a data loading workflow first. See How to Apply Workflows to Portal Widgets.
Choose a chart type
| Chart type | Use it for |
|---|---|
| Doughnut | Shares of a whole, such as cases by status. |
| Vertical Bar | Comparing values across a few categories. |
| Horizontal Bar | Comparing values across categories with long names. |
| Line | Values that change over a sequence, such as dates. |
Add a chart to a page
- Go to Design → Page Builder.
- Open the page in edit mode, or select Create to start a new page.
- In a section, add a grid if there isn’t one yet.
- Select the Chart widget to add it to the grid, or drag it onto the grid.
- Select the Settings icon on the widget to open its configuration panel.
- Fill in the settings in the tables below.
- Select Save.
- Select Publish to show the chart in the portal.
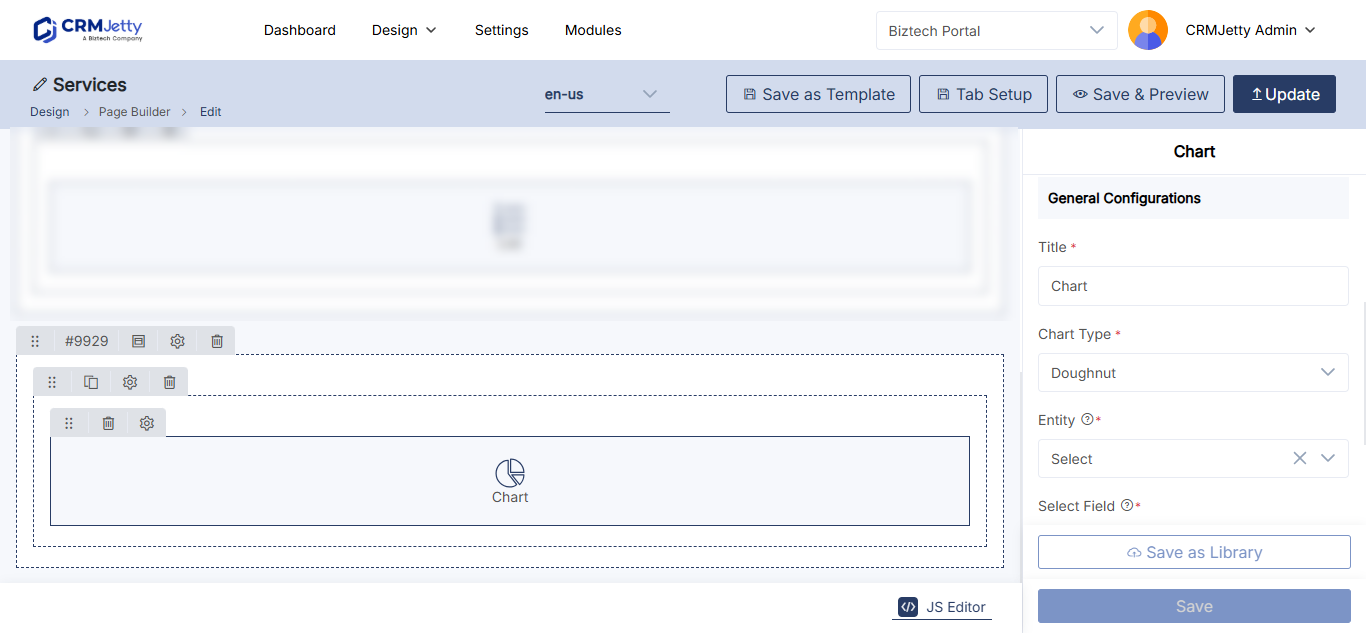
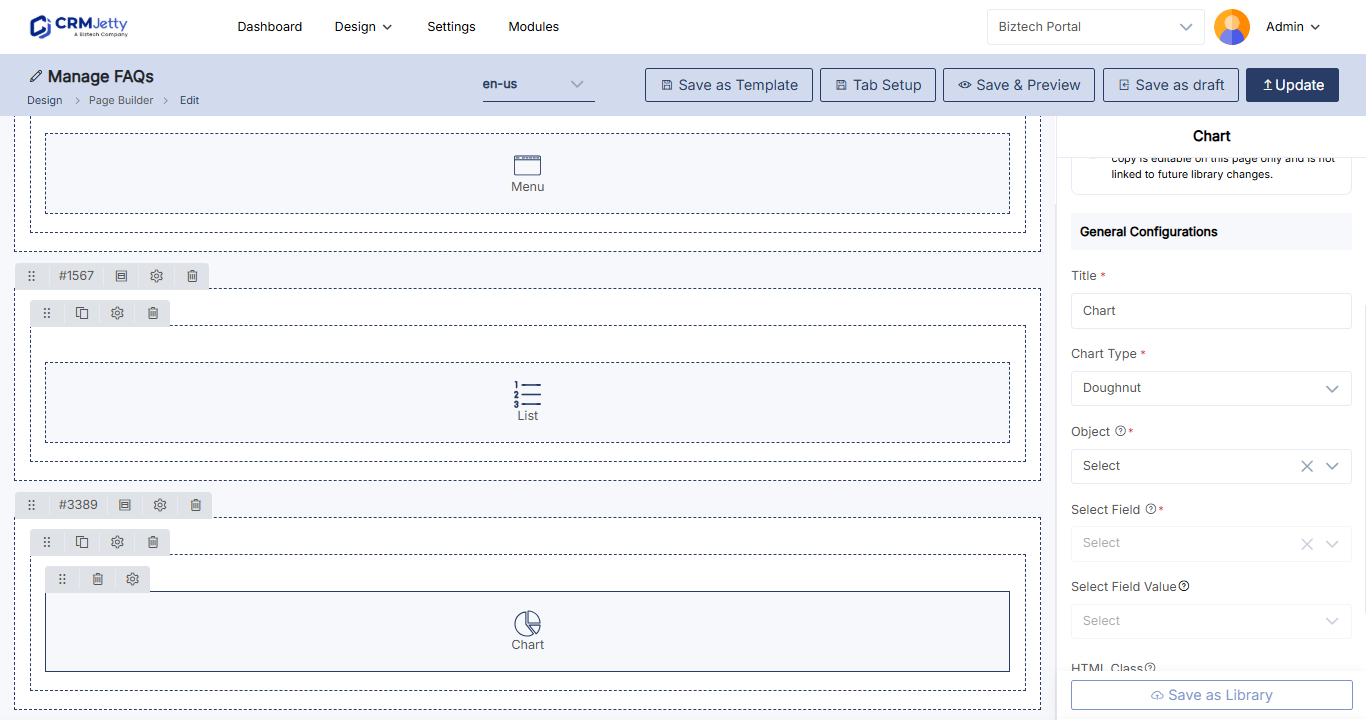
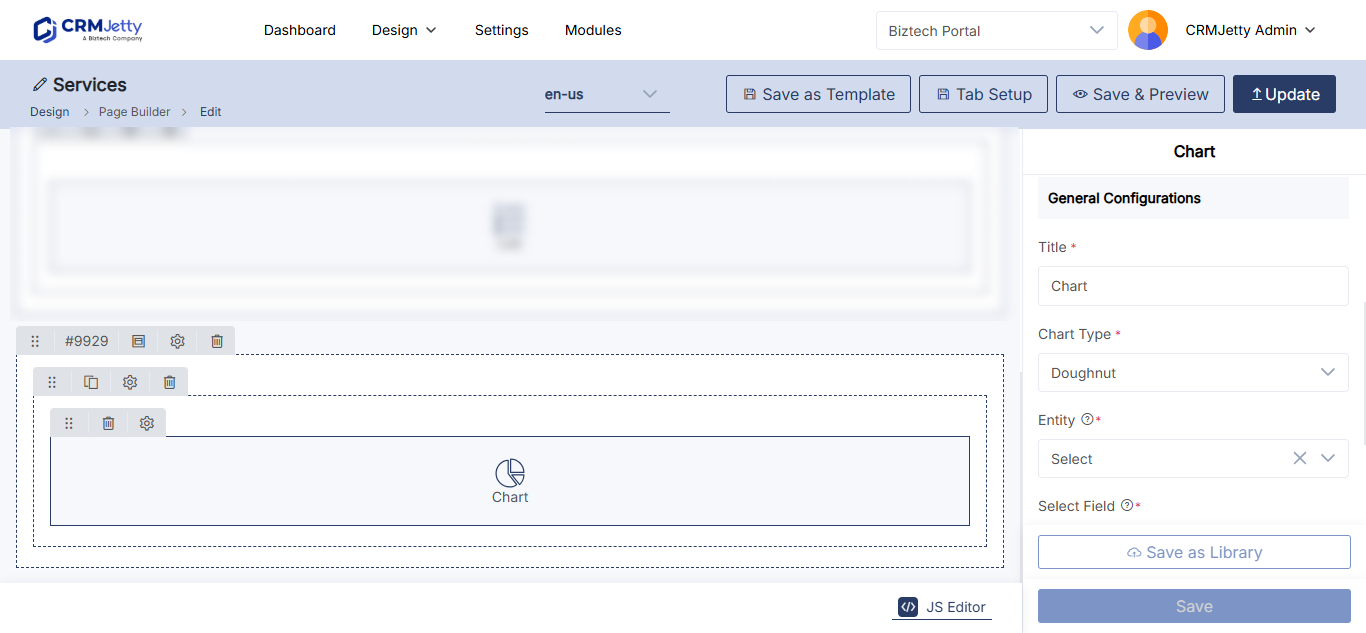
General Configuration
| Setting | What to enter |
|---|---|
| Title | A title that says what the chart shows, for example Open Cases by Status. |
| Chart Type | Doughnut, Vertical Bar, Horizontal Bar or Line. |
| Select Entity | The entity, object or table the chart takes its data from, for example cases or opportunities. |
| Select Field | The field the chart groups records by. The list shows the fields of the selected entity. |
| Select Field Value | The values of that field to show in the chart, for example DHL, FedEx and Full Load for a shipping method field. |
Bar and line charts only
These settings appear when Chart Type is Vertical Bar, Horizontal Bar or Line.
| Setting | What to enter |
|---|---|
| Dataset Label | A label that says what the bars or line represent, for example Number of cases. |
| X–Axis Label | The label on the horizontal axis, usually categories or dates. |
| Y–Axis Label | The label on the vertical axis, usually values or quantities. |
| Calculation Field | The field whose values the chart calculates. |
| Aggregation Types | How the values are combined for each category. |
Workflow Setting and Chart Setting
| Setting | What it does |
|---|---|
| Data Loading Workflow | A workflow that decides which records the chart includes. |
| HTML Class | Custom CSS classes to style the widget. |
| HTML ID | A unique ID for the widget. The portal adds the prefix custom-. |
| Card View | Shows the chart inside a card-style container. |
For HTML Class and HTML ID, see How to Add Custom HTML IDs and CSS Classes to Widgets.
Tip: Place several charts side by side in one grid, together with Counter widgets, to build a dashboard. See How to Build a Customer Portal Dashboard.
Add a chart to a form
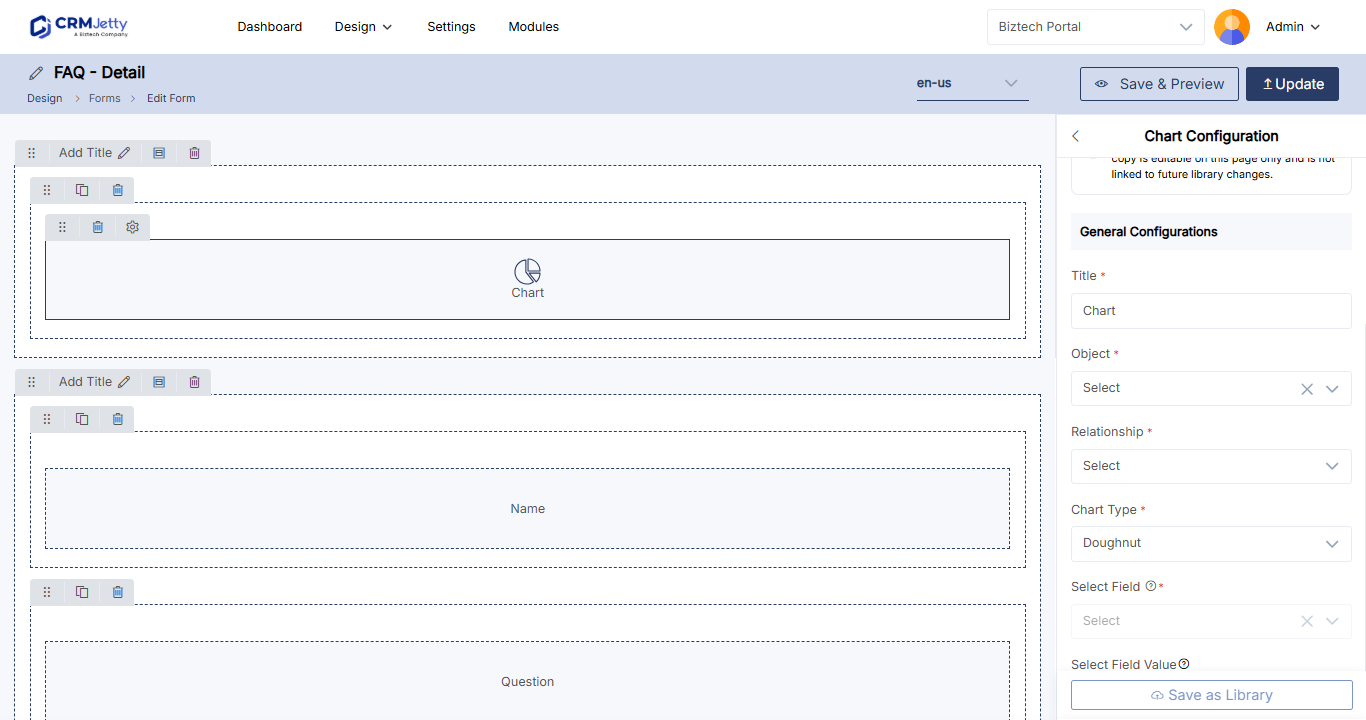
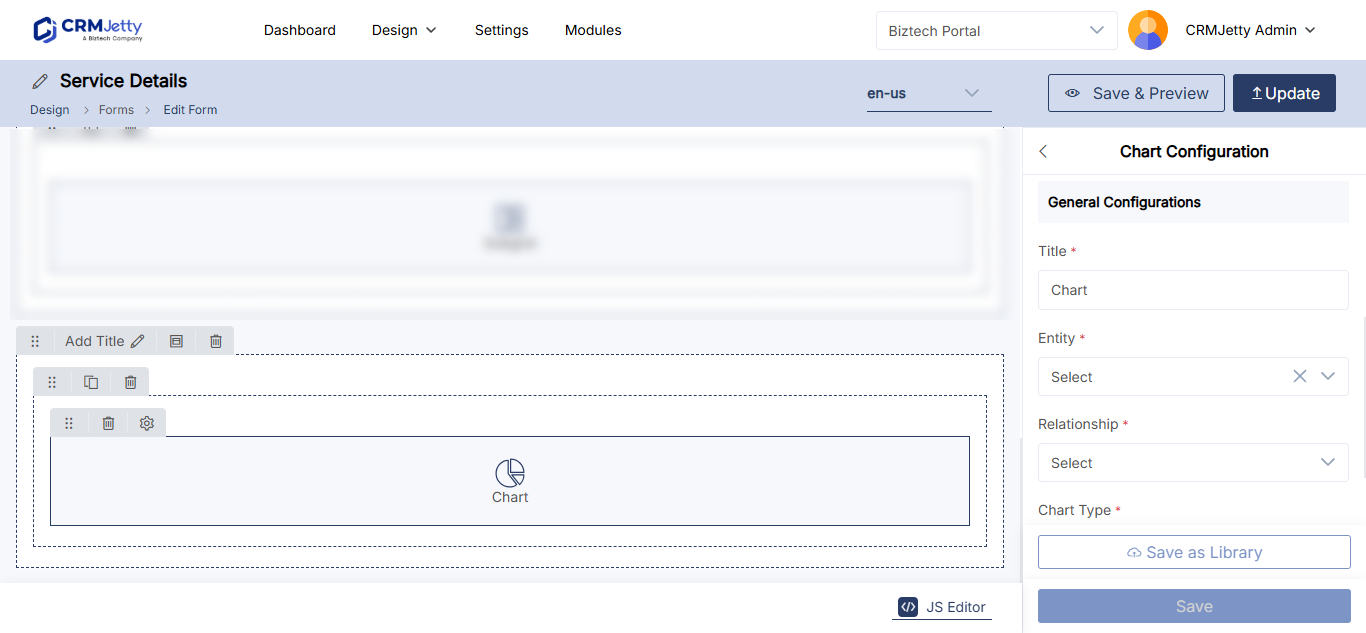
You can also show a chart inside a record’s form, for example a chart of an account’s related cases on the account detail form. The chart widget works only in Edit and Detail type forms.
- Go to Design → Form Builder and open an edit or detail form.
- Drag the Chart widget onto a grid in the form.
- Fill in the settings in the table below.
- Save and publish the form.
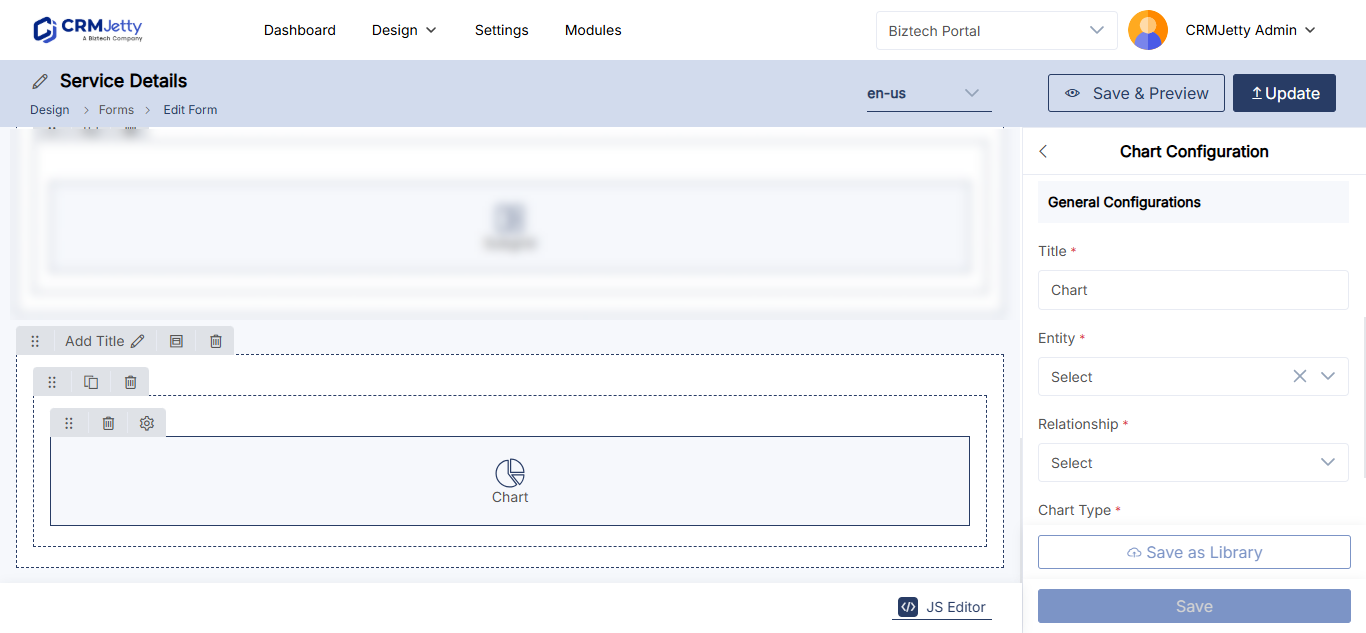
| Setting | What to enter |
|---|---|
| Title | A title for the chart section, for example Chart. |
| Select Entity | The entity the chart section is created for. |
| Select Relationship | The related entity to chart for the record open in the form. |
| Select Chart Type | Doughnut, Vertical Bar, Horizontal Bar or Line. |
| Select Field | The field to show in the chart. |
| Select Field Value | The field values to show. |
| Select Option color | The color for each field value in the chart. |
| Select Data Loading Workflow | Optional. A workflow that decides which related records the chart includes. |
Troubleshooting
The chart is empty: Check that Select Field Value has at least one value selected, and that the portal user has records with those values. A data loading workflow can also filter out every record.
You can’t add a chart to a form: The chart widget works only in Edit and Detail type forms, not in add forms.
The chart does not appear in the portal: Select Save in the widget settings, then publish the page or form.
Related articles
- How to Build a Customer Portal Dashboard
- How to Apply Workflows to Portal Widgets
- How to Show CRM Records as Cards in the Portal