
How to Build a Customer Portal Dashboard
A portal dashboard is a page that gives portal users a summary of their data the moment they sign in: open cases, order status, recent updates and charts. In CRMJetty Portal, a dashboard is an ordinary page you build in Page Builder from dynamic widgets that read data from your CRM, so you can make one for customers, another for partners and another for vendors.
The widgets show data from your CRM; the portal fetches records through your CRM’s APIs, and timing depends on your CRM’s API limits.
Before you start
- You need access to the Design menu in the admin portal.
- Connect your CRM and enable the entities (Dynamics 365), objects (Salesforce) or tables (Business Central) you want to show. See How to Enable CRM Entities and Custom Objects in the Portal.
- Check that the portal user roles that will see the dashboard have permission to view those entities in Entity Permissions (Business Central: Table Permissions). See How to Create Portal User Roles and Permissions.
- To show data cards, create the list the card reads from first. See How to Create List Views in CRMJetty Portal.
- To limit each widget to the portal user’s own records, create a workflow first. See How to Apply Workflows to Portal Widgets.
Plan the dashboard
Choose a widget for each thing you want portal users to see.
| Widget | Shows | Example |
|---|---|---|
| Counter | A count of records with a chosen field value. | Number of open cases |
| Chart | CRM data as a Doughnut, Vertical Bar, Horizontal Bar or Line chart. | Cases by priority |
| Data Card | Records from a list in a compact card layout. | Latest orders as cards |
| Recent Activity | The latest records or updates for an entity. | Recently updated cases |
| Global Filter | One filter bar for the page. It applies to each List and Data Card widget where you turn on Enable Global Filter (Business Central: also Chart and Recent Activity widgets). | Filter the case list and cards by account at once |
| Power BI | An embedded Power BI report or dashboard. | Sales performance report |
The Counter, Chart, Data Card and Recent Activity widgets are included in every plan. The Global Filter and Power BI widgets are available on selected plans; see How to Filter All Dashboard Widgets at Once and How to Embed Power BI Reports in the Portal.
Create the dashboard page
- Go to Design → Page Builder.
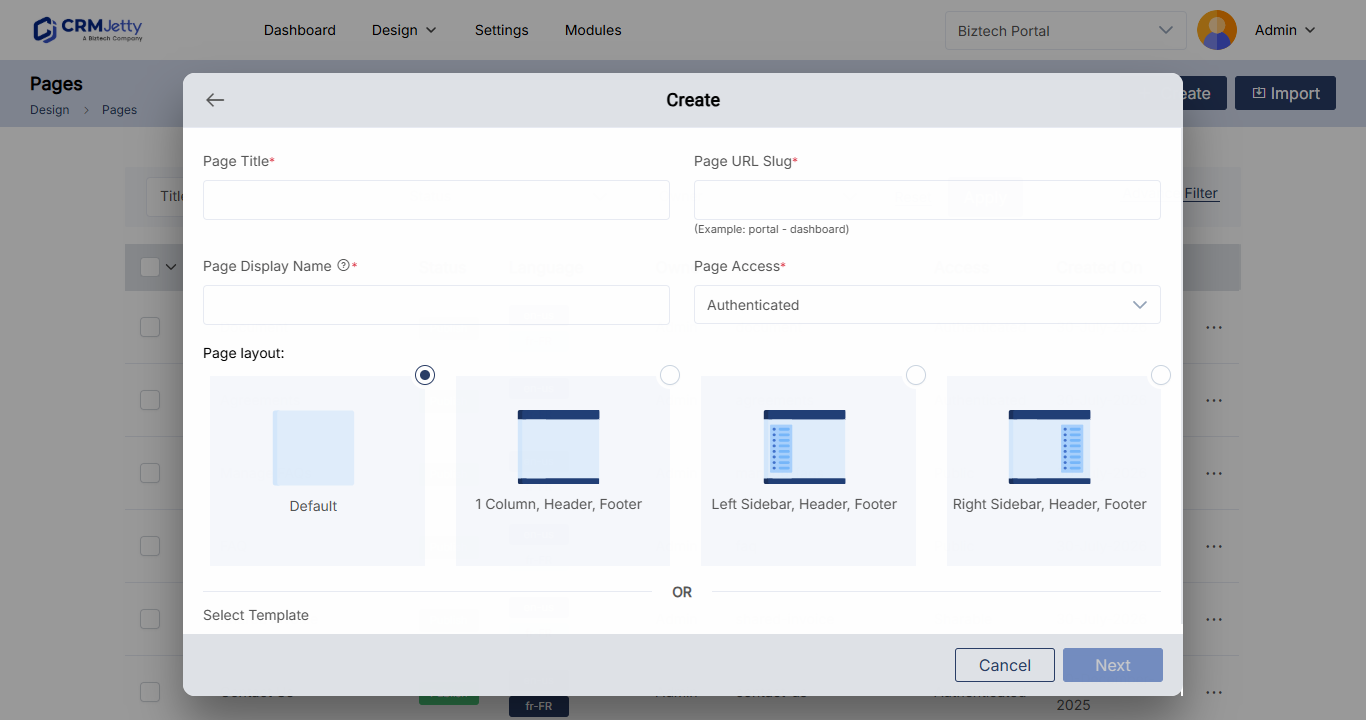
- Select Create.
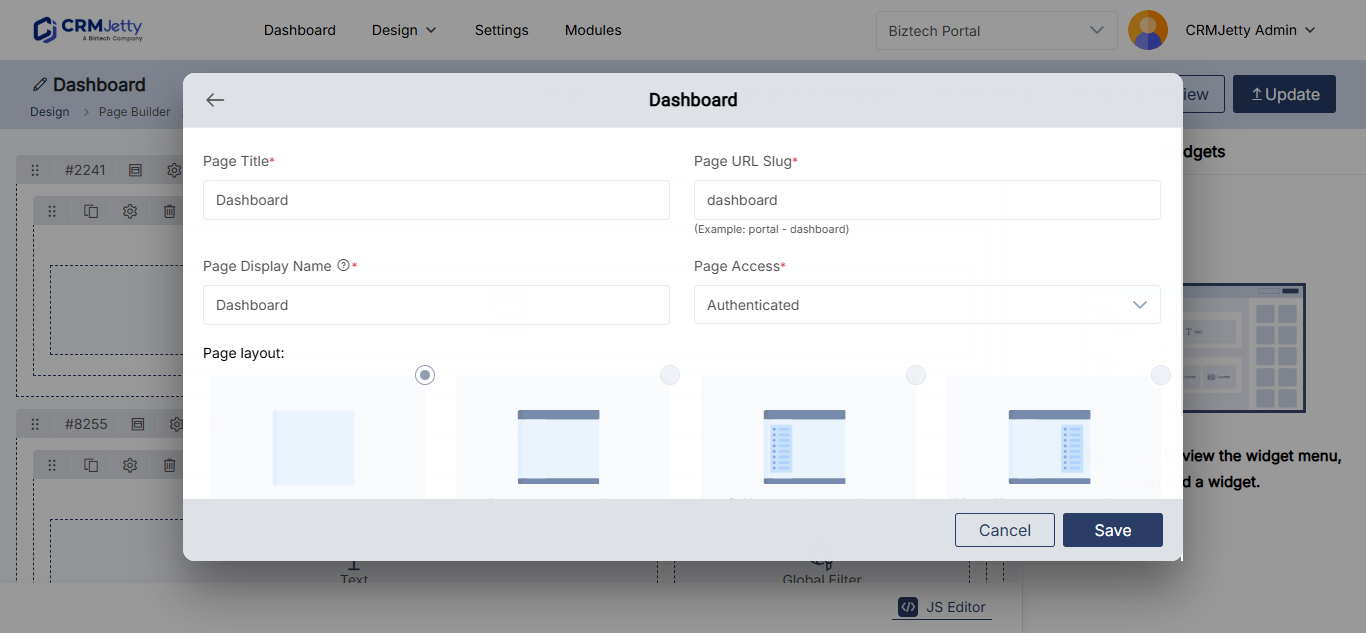
- Enter a Page Title, for example
Dashboard. - Enter a Page URL Slug, for example
portal-dashboard. - Enter the Page Display Name shown in menus and breadcrumbs.
- Set Page Access to Authenticate so only signed-in portal users can open it.
- Choose a Page Layout, or pick a template in Select Template.
- Select Next to open the page layout editor.
For every page setting, see How to Create Pages in CRMJetty Portal.
Lay out sections and grids
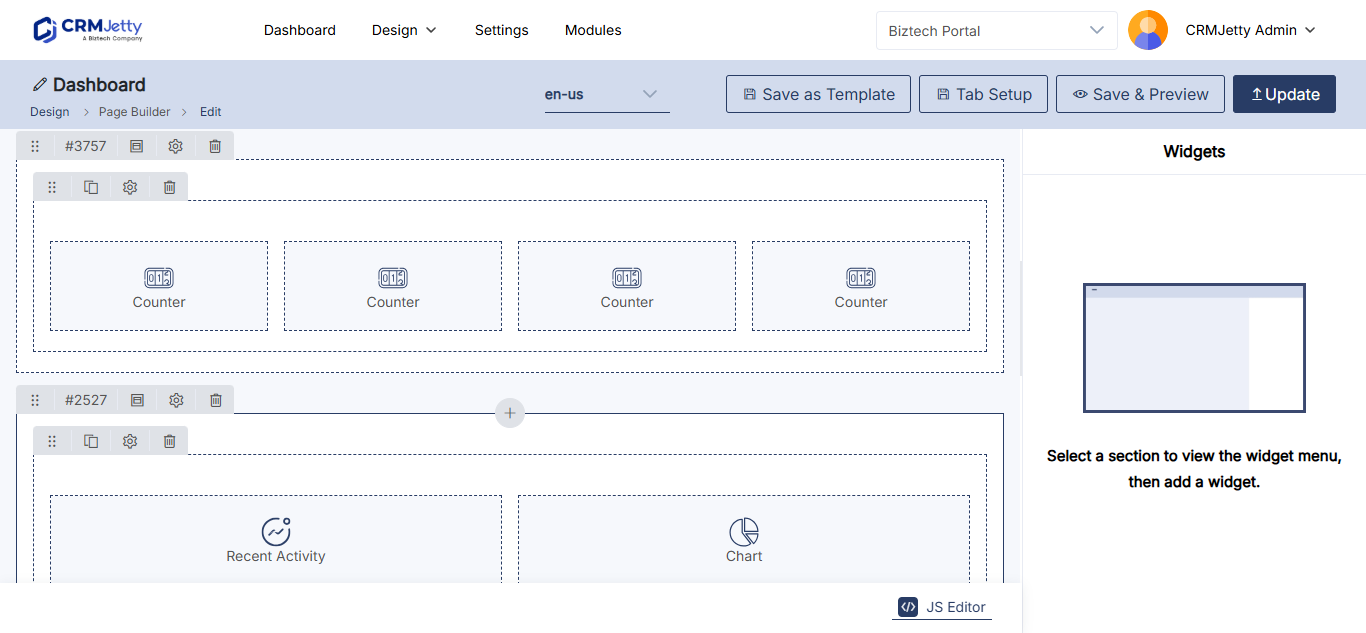
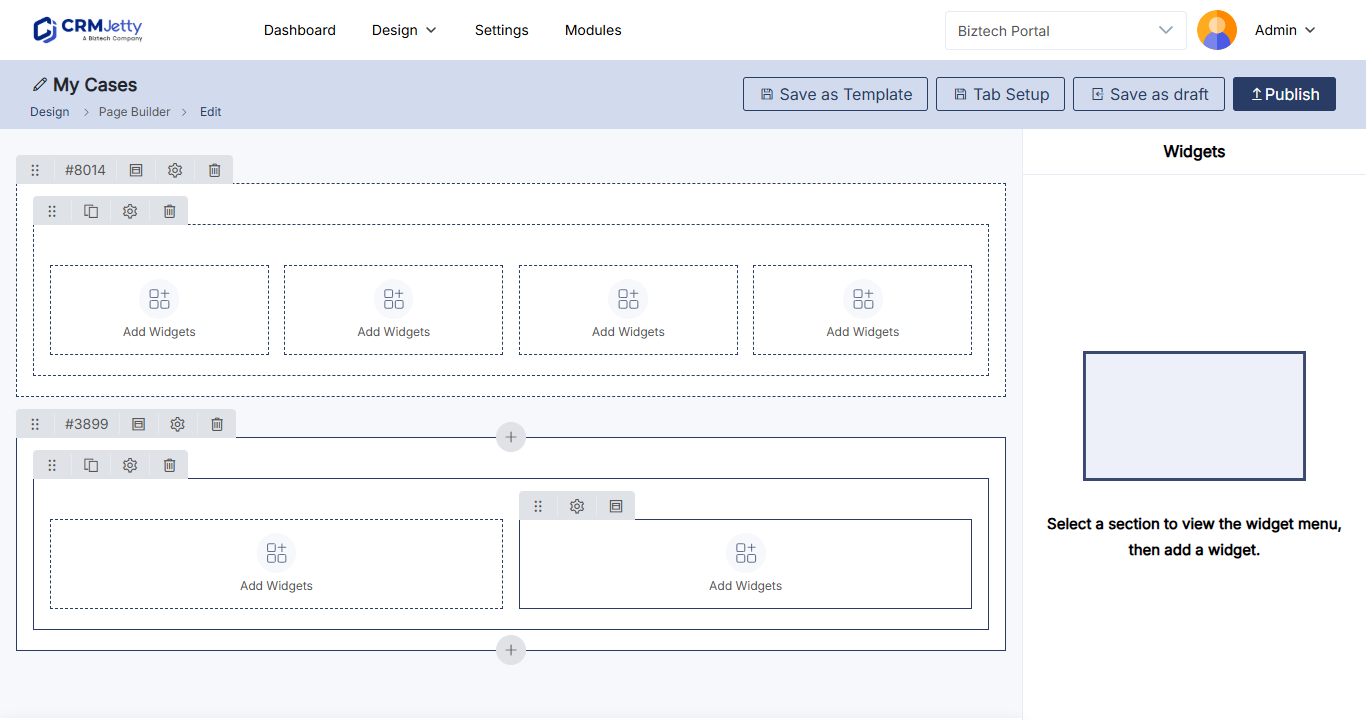
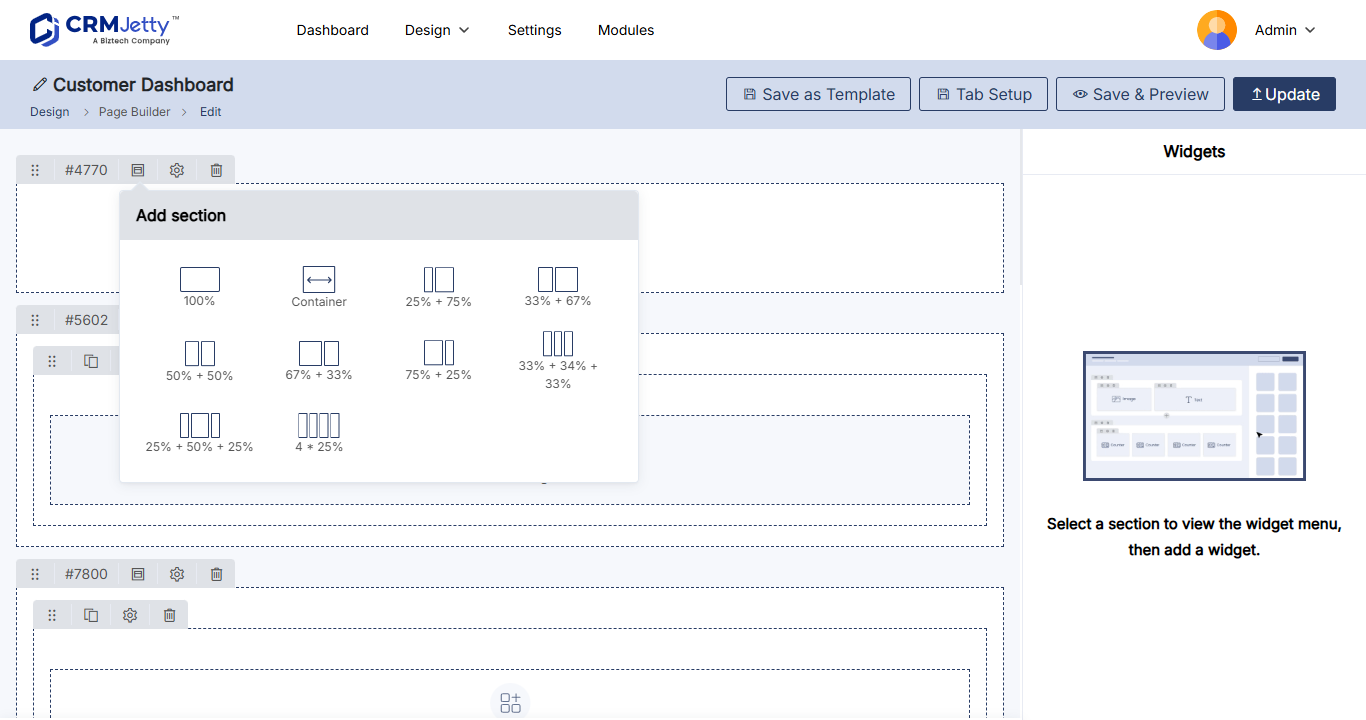
- Select the + icon on the left to add a section.
- In the section, select Add Grid and choose a grid layout. For a row of counters, choose a grid with three or four columns.
- Add more sections for charts and lists, for example a two-column grid for two charts side by side.
Add counters
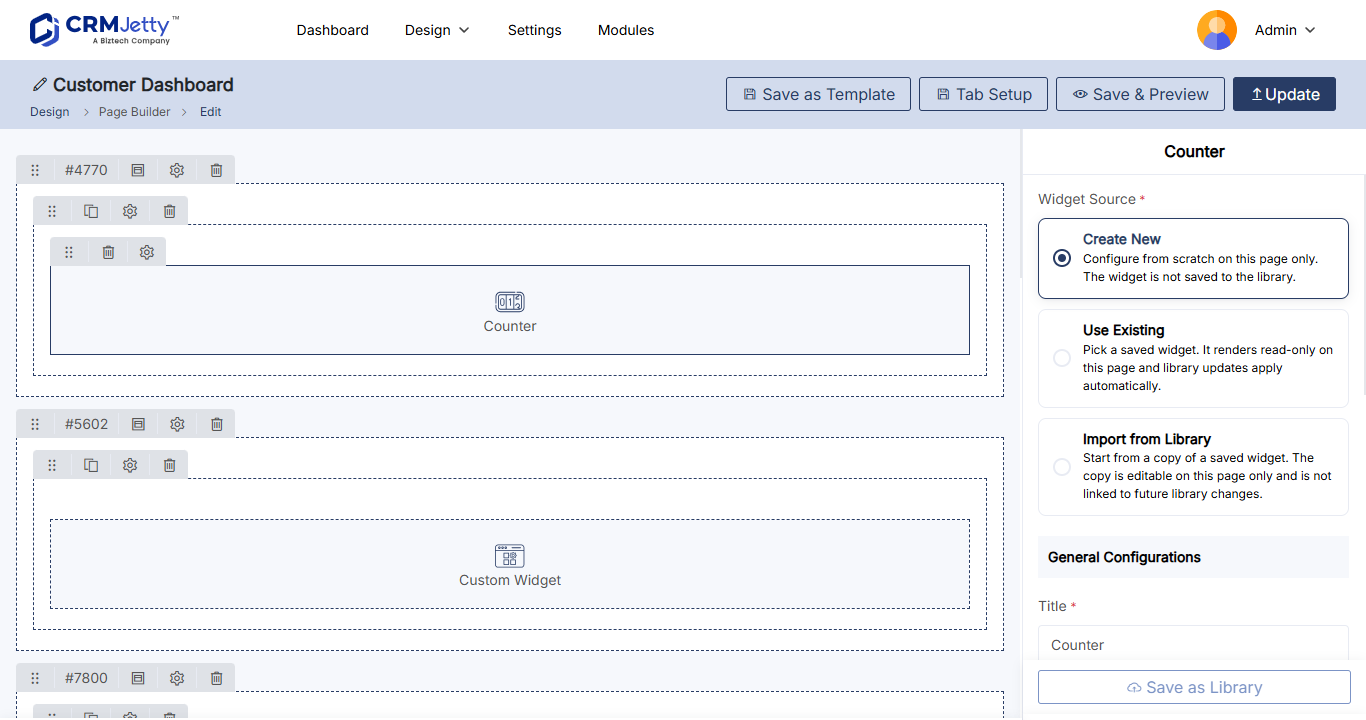
- Select the Counter widget. It is added to the grid.
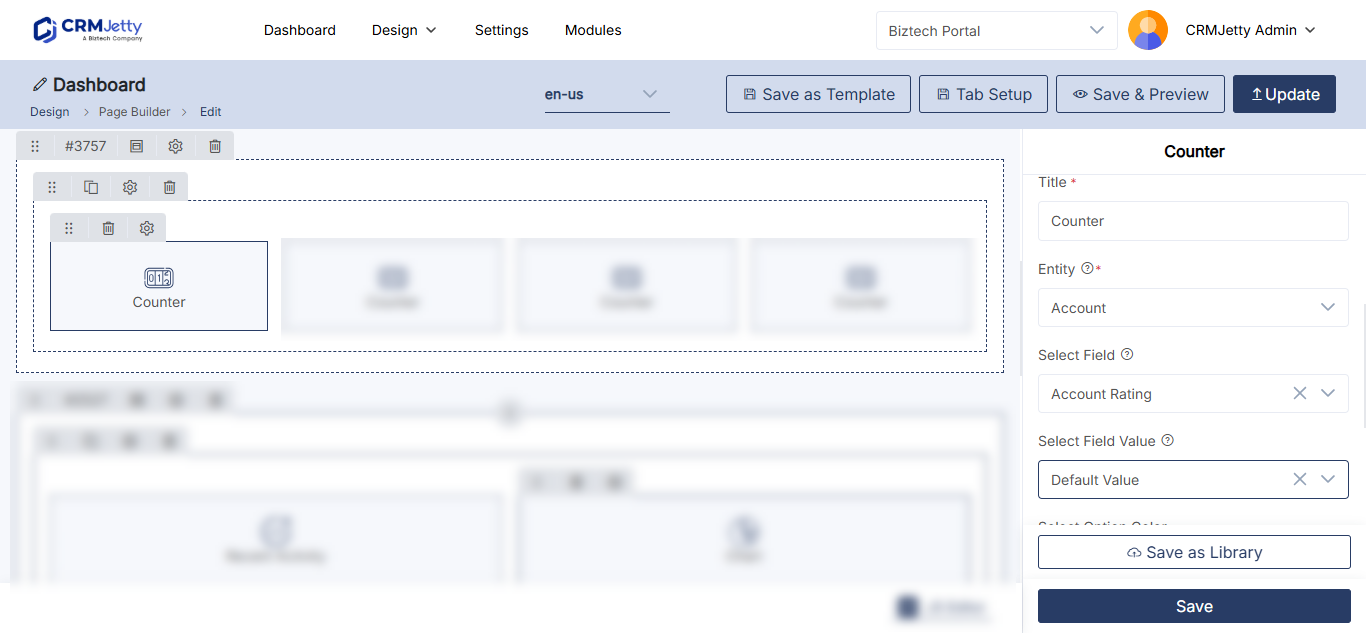
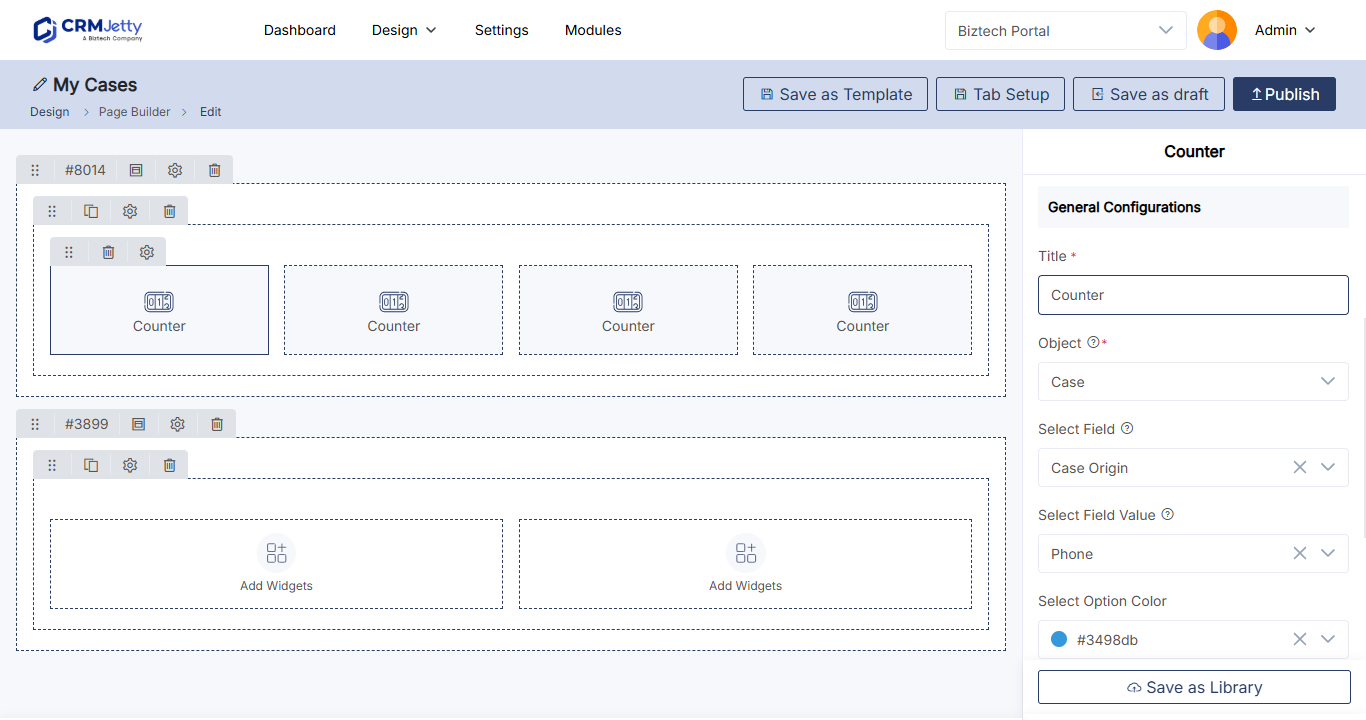
- Select the widget’s Settings icon to open its configuration panel.
- Fill in the settings below.
- Select Save.
| Setting | What to enter |
|---|---|
| Title | What the counter represents, for example Open Cases. |
| Select Entity | The CRM entity the counter counts, for example cases. |
| Select Field | The field used to generate the count. |
| Select Field Value | The value or values to count, for example Active. |
| Select Option Color | The color of the counter. |
| Pick an Icon | The icon shown on the counter. |
| Redirection Setting | Turn on to make the counter link to a page. Choose Clickable Icon to make the whole counter clickable, or Hyperlink to show a link beneath it, then pick the page in Select Page. |
| Data Loading Workflow | Optional. The workflow that decides which records are counted. |
Tip: Point each counter at the list page for the same records, so portal users can select a counter to see the records behind the number.
Add charts
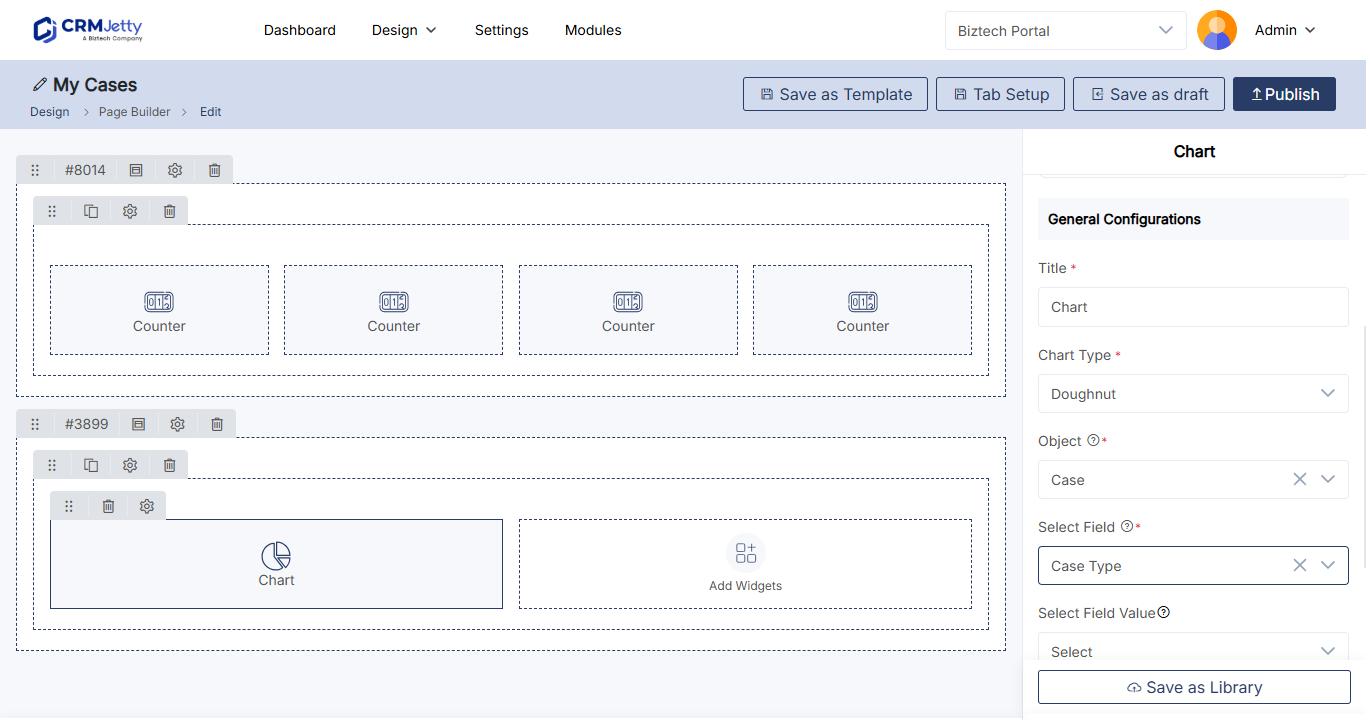
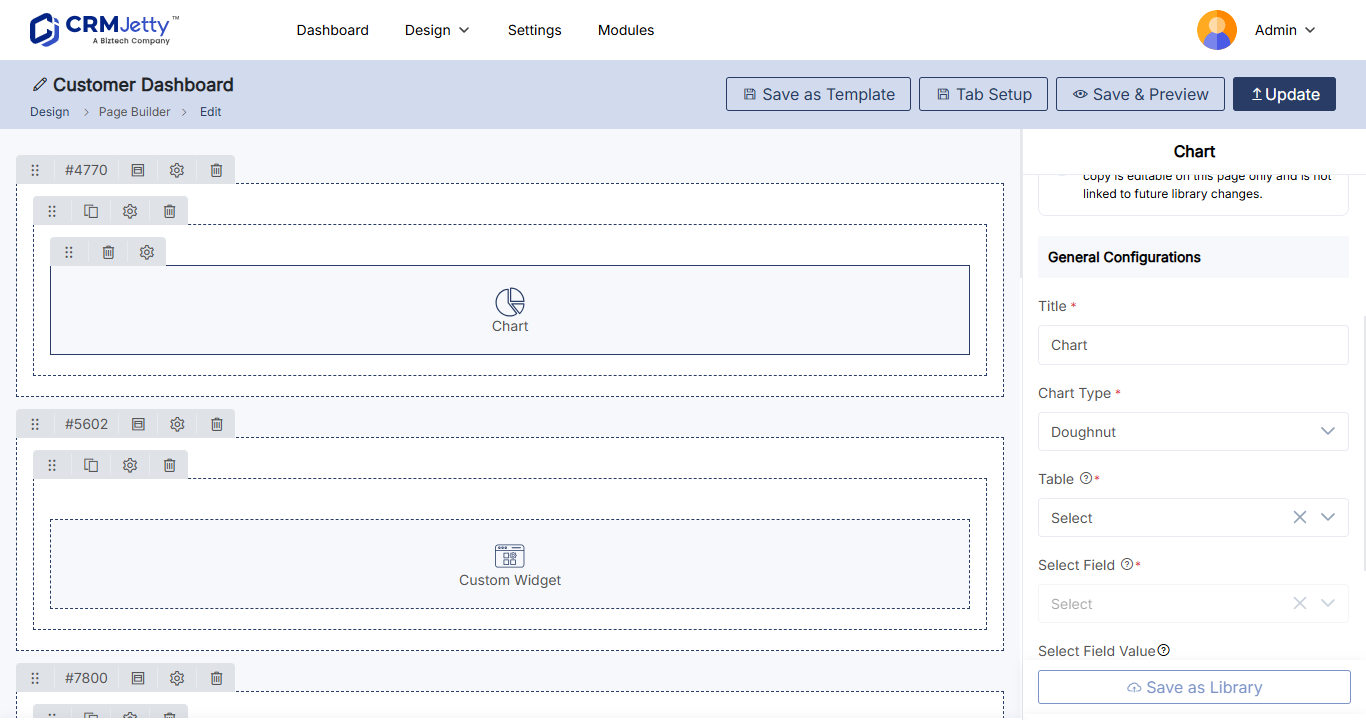
- Select the Chart widget, then its Settings icon.
- Enter a Title.
- Select a Chart Type: Doughnut, Vertical Bar, Horizontal Bar or Line.
- Select the entity in Select Entity and the field in Select Field.
- Choose the values to show in Select Field Value.
- Select Save.
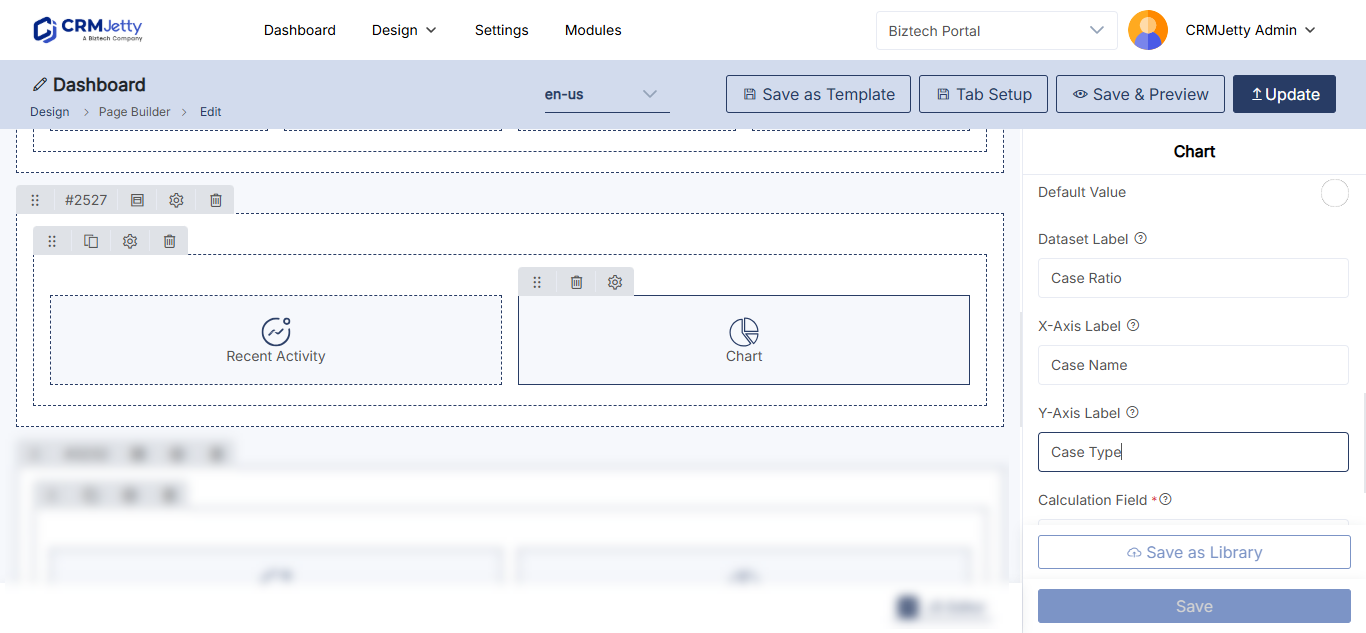
For Vertical Bar, Horizontal Bar and Line charts, also fill in:
| Setting | What to enter |
|---|---|
| Dataset Label | What the data represents, shown on the chart. |
| X–Axis Label | The label for the horizontal axis, such as categories or dates. |
| Y–Axis Label | The label for the vertical axis, such as counts or amounts. |
| Calculation Field | The field the chart calculates values from. |
| Aggregation Types | How the values are combined. |
See How to Add Charts to Your Customer Portal.
Add data cards and recent activity
Data Card:
- Select the Data Card widget, then its Settings icon.
- Enter a Data Card Title.
- In Select Card View, select the list that supplies the data.
- Set the header, sub-header and other card fields you want to show.
- Select Save.
See How to Show CRM Records as Cards in the Portal.
Recent Activity:
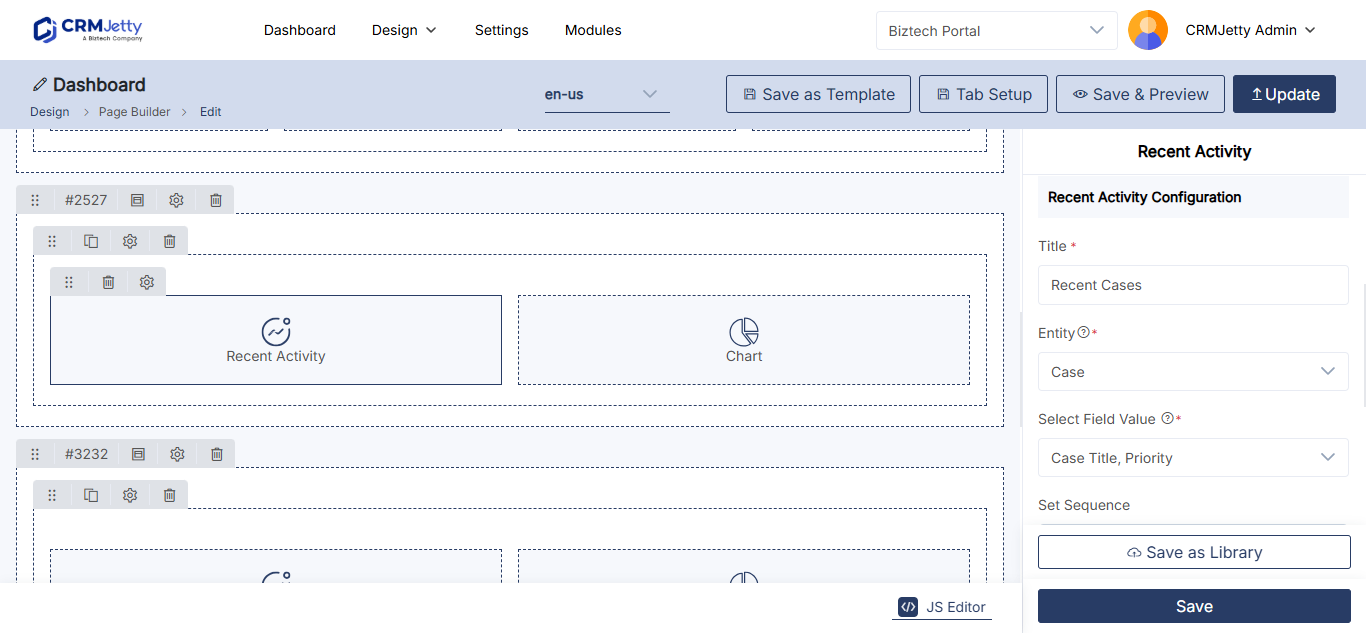
- Select the Recent Activity widget, then its Settings icon.
- Enter a Title, for example
Recent Activity. - In Select Entity, choose the entity to show.
- In Select Redirection Page and Select Detail Page, choose the pages portal users open from an item.
- Select Save.
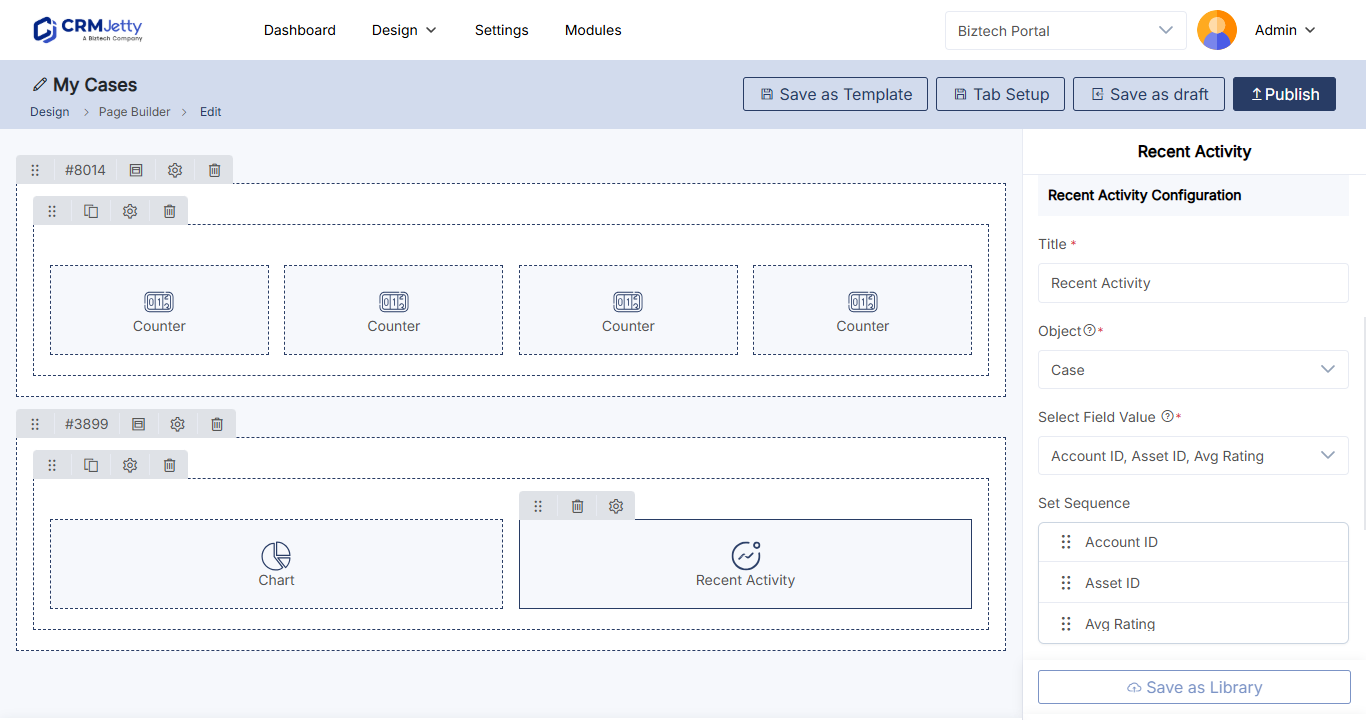
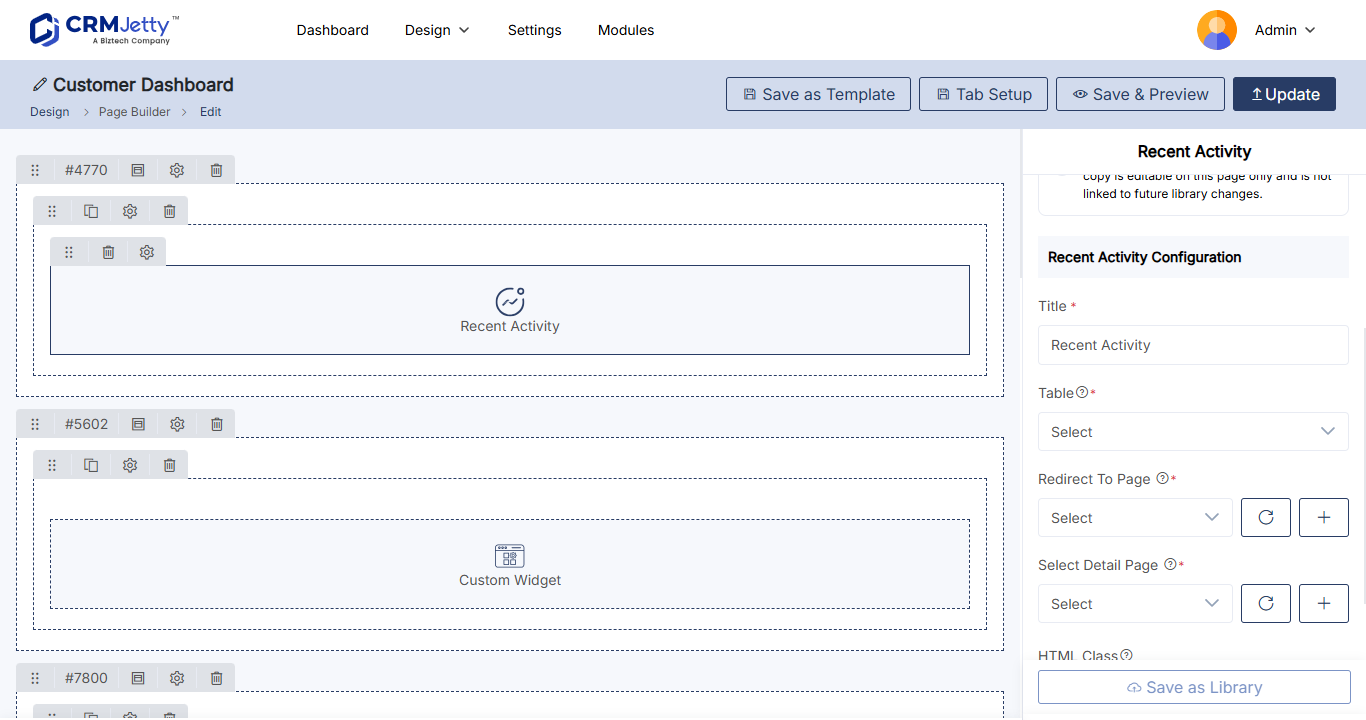
The Counter, Chart, Data Card and Recent Activity widgets also have HTML Class, HTML ID and Card View settings. Turn on Card View to show the widget as a card; use the class and ID to style it with CSS. See How to Add Custom HTML IDs and CSS Classes to Widgets.
Show only each portal user’s data
To limit a counter, chart, data card or recent activity widget to records related to the portal user, select a workflow in its Data Loading Workflow setting. See How to Apply Workflows to Portal Widgets.
Publish the dashboard
- Select Publish. The page goes live in the portal.
- Add the page to your navigation menu. See How to Create Portal Navigation Menus.
- Optionally, send portal users to the dashboard when they sign in, with a different dashboard for each role. See How to Redirect Users After Login by Role.
Tip: Once the layout works, select Save as Template to reuse it for other dashboards, such as a partner or vendor dashboard. See How to Create and Reuse Portal Page Templates.
Troubleshooting
A widget shows no data or a count of 0: Check that the entity is enabled in the portal, that the portal user’s role can view it, and that the Data Loading Workflow isn’t filtering out every record.
The dashboard doesn’t appear in page selection or menus: The page is still a draft. Publish it. See Why a Portal Page Is Missing from Page Selection.
Related articles
- How to Create Pages in CRMJetty Portal
- How to Add Charts to Your Customer Portal
- How to Apply Workflows to Portal Widgets